

A broad human-rated dataset
10,000 diffusion and 4,000 classic outputs, selected from a diverse generation pool and scored directly by observers.
 DISRQAD
A DATASET & BENCHMARK FOR DIFFUSION-BASED SUPER-RESOLUTION
Moscow, Russia · * Corresponding author
01 / OVERVIEW
Diffusion-based super-resolution can create visually plausible detail that is not supported by the low-resolution input. Do image quality metrics agree with people?
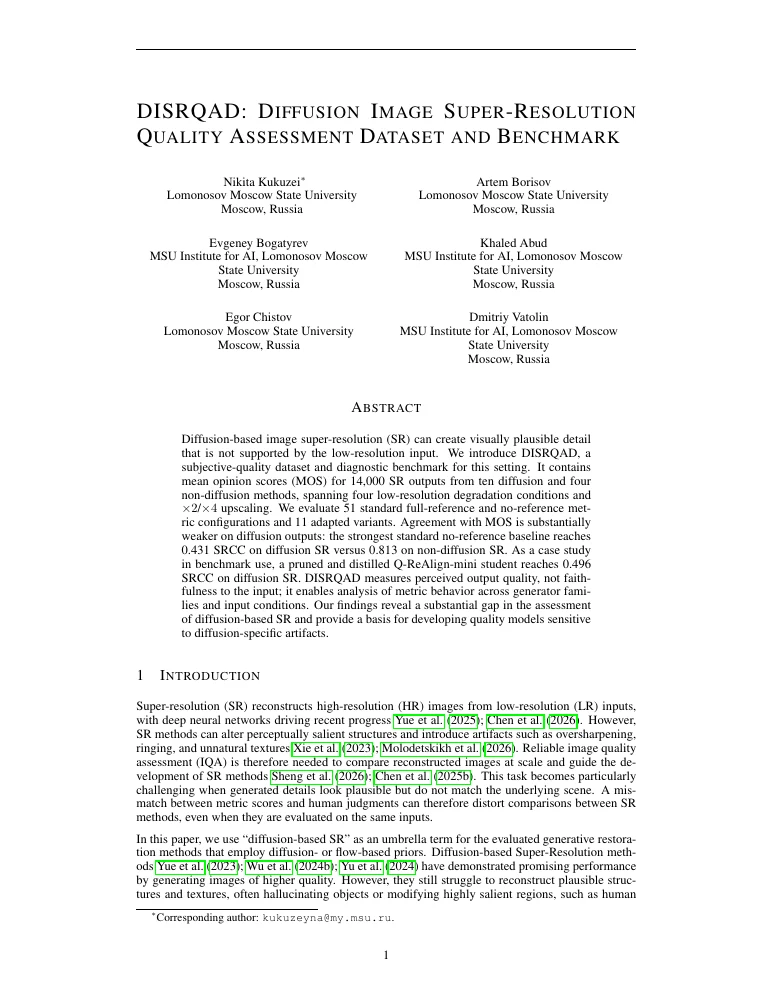
We introduce DISRQAD, a subjective-quality dataset and diagnostic benchmark with mean opinion scores for 14,000 outputs from ten diffusion and four non-diffusion methods, four low-resolution degradation conditions, and ×2 / ×4 upscaling. We evaluate 51 standard full-reference and no-reference configurations and 11 adapted variants.
Agreement with MOS is substantially weaker on diffusion outputs. The strongest standard NR baseline reaches 0.431 SRCC on diffusion SR; the strongest standard NR correlation on non-diffusion SR is 0.813. A pruned and distilled Q-ReAlign-mini student reaches 0.496 on diffusion SR.
What the scores mean. DISRQAD measures perceived output quality. Raters see neither the LR input nor the HR reference; visually attractive but scene-inconsistent details may receive high scores. Fidelity and semantic preservation are separate assessment targets.
10,000 diffusion and 4,000 classic outputs, selected from a diverse generation pool and scored directly by observers.
Traditional, CNN and vision–language IQA, evaluated separately by SR family, generator, degradation and scale.
Fine-tuning analysis and an efficient student illustrate both the potential and the trade-offs of SR-specific training.
Super-resolution can introduce oversharpening, ringing, unnatural textures, hallucinated objects and changes to salient regions such as faces. A visually attractive output may differ from the LR evidence and the HR reference. DISRQAD isolates the perceived quality of the output as one assessment target.
Full-reference (FR) metrics compare an output to HR: PSNR and SSIM measure pixel or structural correspondence; LPIPS and DISTS compare features; ERQA emphasizes edges; A-FINE relaxes the perfect-reference assumption. No-reference (NR) metrics see only the output: NIQE uses natural-scene statistics; MUSIQ learns subjective ratings; Q-Align and DEQA use vision–language representations. NeuralSBS learns SR preferences; FGResQ combines scores and restoration rankings. Reduced-reference methods use limited reference information and are not a separate track in this benchmark.
SBS180K records preferences between outputs from the same input. FGRestore and LL-Bench combine pairwise preferences and image-level scores across restoration tasks. The RQI study examines FR / NR disagreement on SR preferences. DISRQAD keeps the task fixed to still-image SR and varies generator family, using direct five-category ratings. Video-SR benchmarks such as VSRQAD and studies of codec-compressed or streaming SR address temporal and video-specific artifacts outside this setting.
SRCC measures ranking agreement; PLCC measures linear agreement. Kendall correlation is another common IQA measure, but the supplied numeric tables here report SRCC and PLCC. Bibliographic references for the methods and related work are available in the full PDF.
02 / THE DATASET
Source selection, controlled degradations, broad SR coverage and direct human ratings.
KonIQ-10K, COCO, AVA and FLIVE. Structural and semantic clustering selects detailed, visually clean sources.
Four LR conditions at two scales produce 80,288 inputs. This is the full source pool, before output sampling.
802,880 diffusion + 321,152 non-diffusion outputs. Feature clustering selects 14,000 for human annotation.
More than 80 observers; at least 13 ratings per output on a five-category no-reference quality scale.
DIFFUSION & FLOW PRIORS
CONVENTIONAL COMPARISON TRACK
Four LR conditions: resized, Gaussian blur, additive noise and JPEG compression. Both ×2 and ×4 are evaluated.
Earlier datasets emphasize non-diffusion SR. SRIQA-Bench and ISRGen-QA include five diffusion methods each. DISRQAD expands generator coverage within a common direct-rating protocol. Pairwise preferences and absolute scores answer different questions.
| Dataset | Sources | SR outputs | Non-diff. methods | Diffusion methods | Human input |
|---|---|---|---|---|---|
| CVIU-2017 | 30 | 1,620 | 9 | 0 | Ratings |
| QADS | 20 | 980 | 21 | 0 | Pairs |
| SISRSet | 15 | 360 | 8 | 0 | Pairs |
| RealSRQ | 60 | 1,620 | 10 | 0 | Pairs |
| SISAR* | 100 | 12,600* | 10* | 0 | Ratings |
| SRIQA-Bench | 100 | 1,000 | 5 | 5 | Pairs |
| ISRGen-QA | 19 | 720 | 10 | 5 | Ratings |
| RQI study | 312 | 2,184 | 4 | 3 | Pairs |
| DISRQAD | 10,036† | 14,000 | 4 | 10 | Ratings |
* SISAR directly rates 1,800 outputs; 10,800 scores are inferred. Its method count includes six SR algorithms and four combined operations. † DISRQAD reports the full source pool, not the number of unique sources in the rated subset. SISAR sources are LR inputs; other source counts refer to HR inputs.
03 / THE BENCHMARK
High agreement on classic SR does not guarantee agreement on generated detail.
Across the 51 standard configurations, median SRCC drops from 0.65 to 0.27; median PLCC drops from 0.60 to 0.31.
SRCC · higher is better · selected baselines and the distilled student. The strongest standard diffusion NR baseline is Q-ReAlign-pro (0.431).
Signed correlations with direct MOS. Lower-is-better metrics are sign-reversed; PLCC is computed without nonlinear fitting. The two SR families are evaluated separately.
| Metric | Type | Non-diff. SRCC | Non-diff. PLCC | Diffusion SRCC | Diffusion PLCC |
|---|
FT = fine-tuned on SRIQA-Bench. The distilled student is shown separately from standard baselines. MOS-annotated DISRQAD outputs are evaluation data for these results; these adapted baselines were not trained on their MOS.
04 / DIAGNOSTIC ANALYSIS
Explore correlations within each generator, degradation and upscaling subset.
| Subset | PSNR · FR | TOPIQ-FR | Q-Align · NR | Distilled student · NR |
|---|
Each coefficient uses only its indicated subset. Colors indicate correlation magnitude, not statistical significance.
PassionSR and ResShift yield the highest within-method SRCC for 36 and 20 of 62 variants. DiT4SR yields the lowest for 38. CODSR and PASD have median SRCCs of 0.135 and 0.158.
On diffusion SR, blur yields the highest SRCC for almost all metrics. The distilled student reaches 0.542 on blur, compared with 0.466 on resized inputs.
52 of 62 variants have higher diffusion SRCC at ×4 than ×2. For non-diffusion SR, only 25 variants follow this direction.
05 / DOMAIN ADAPTATION
SR-specific supervision can improve diffusion agreement while reducing performance elsewhere.
Ten baselines were fine-tuned on SRIQA-Bench: AHIQ, LPIPS-AlexNet, LPIPS-VGG, PieAPP, TOPIQ-FR, ARNIQA, MUSIQ, LIQE, TOPIQ-NR and Q-ReAlign-mini. Three improved on both SR tracks; other effects depend on the metric and domain.
Simple fine-tuning substantially reduced quality on non-SR distortions in KonIQ-10K, KADID and SPAQ. Specialized training should preserve broader IQA behavior rather than optimize only one track.
See all adapted configurations →Diffusion SRCC0.397 → 0.436
Non-diffusion SRCC0.811 → 0.694
Diffusion SRCC0.273 → 0.308
Non-diffusion SRCC0.605 → 0.497
Batch size 8, up to 30 epochs, initial learning rate 10⁻⁴, MSE against MOS, Adam optimizer, and checkpoint selection by SRCC using the IQA-PyTorch interface. LIQE uses 5 × 10⁻⁶ for convergence; Q-ReAlign-mini is limited to 2 epochs because of its model size and rapid convergence.
06 / AN EFFICIENT SR-ADAPTED METRIC
A pruned and hierarchically distilled Q-ReAlign-mini student, followed by SR adaptation.
Remove two Gated DeltaNet modules from each four-module group. Keep the visual encoder and restrict the vocabulary to 30 tokens.
Match visual features, language features, attention, teacher scores and quality-token distributions on general IQA data.
990 SRIQA-Bench training images + 248 general-IQA images; 110 SRIQA-Bench images select the checkpoint.
| Model | Params | VRAM | FPS | SRIQA-Bench* | Diffusion | Non-diffusion |
|---|---|---|---|---|---|---|
| Q-ReAlign-mini | 0.8B | 2.3 GB | 3.76 | 0.479 / 0.504 | 0.341 / 0.393 | 0.683 / 0.597 |
| Q-ReAlign-lite | 4.0B | 10.7 GB | 2.69 | 0.475 / 0.519 | 0.405 / 0.458 | 0.772 / 0.719 |
| Q-ReAlign-pro | 9.0B | 19.2 GB | 2.65 | 0.428 / 0.488 | 0.431 / 0.469 | 0.760 / 0.716 |
| Q-Align | 8.2B | 16.0 GB | 5.39 | 0.624 / 0.677 | 0.415 / 0.487 | 0.813 / 0.758 |
| Distilled student | 0.34B | 1.3 GB | 6.37 | 0.755 / 0.794 | 0.496 / 0.542 | 0.729 / 0.747 |
NVIDIA RTX A6000 · BF16 · 512 × 512 inputs. * The 110-image SRIQA-Bench split is validation for checkpoint selection, not an independent test set.
09 / READ THE PAPER
Paper PDF and supplementary material are available here.
Diffusion Image Super-Resolution Quality Assessment Dataset and Benchmark
Nikita Kukuzei, Artem Borisov, Evgeney Bogatyrev, Khaled Abud, Egor Chistov, Dmitriy Vatolin.
A page preview and direct PDF link remain available on devices without embedded PDF support.
The arXiv preprint is available at arXiv:2610.09077 ↗.
10 / CITATION & CREDITS
BibTeX citation for the arXiv preprint.
@misc{kukuzei_disrqad,
  title = {DISRQAD: Diffusion Image Super-Resolution Quality
           Assessment Dataset and Benchmark},
  author = {Kukuzei, Nikita and Borisov, Artem and
            Bogatyrev, Evgeney and Abud, Khaled and
            Chistov, Egor and Vatolin, Dmitriy},
  journal = {arXiv preprint arXiv:2610.09077},
  year = {2026},
  eprint = {2610.09077},
  url = {https://arxiv.org/abs/2610.09077}
}The research was carried out using the MSU-270 supercomputer of Lomonosov Moscow State University.
Construction, protocol, evaluation and training settings are documented above and in the full paper. The authors disclose AI assistance with translation, language editing, code drafting and revision, and literature identification; they reviewed the material and take responsibility for the results.
10 / PARTICIPATE
We evaluate image quality assessment metrics for the Diffusion SR task.
Submit human judgments to compare IQA metrics on diffusion-based super-resolution outputs.